
The first part of this discussed the heterogeneity of data projects and how a uniform approach can help hone in the solution. The first post also discussed the first two elements: Refine the question, and identifying the right data. Here we tackle the next two elements.

Plan Your Approach
At this step, we begin to go into the technicalities of data science. This post is not designed to go into the detail of each approach, but it will attempt to ask the relevant questions.
How will you process the data that you now possess? In almost all cases, this step will involve data wrangling (also known as data munging or data cleaning). To determine how the “clean” form your data must take for proper analysis, it is important to determine the transformations and algorithms necessary for your question.
It is valuable to determine whether the informatics question requires a descriptive, diagnostic, predictive, or prescriptive level of analysis.
- Are you just trying to understand a problem such that knowing the mean, standard deviation, and range of the data points would suffice?
- Are you trying to extrapolate historical data to inform possible placement of future data points?
- Are you attempting to create a model where a computer can make some medical decisions when it has near 100% probability of being appropriate?
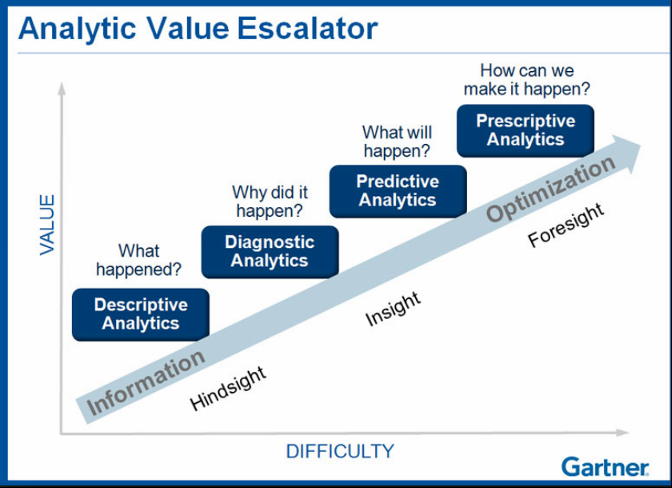
Source: Gartner
From the purpose of the data-driven approach, deriving the algorithmic approach becomes easier. For instance, using natural language processing on diagnostic reports may require significant pre-processing. Predictive and/or prescriptive approaches often require statistical learning techniques which would rely on well-defined features. Therefore, a process that some call feature engineering may be necessary.
Other things to contemplate as part of this step also include: How do you get your ground truth? How do you verify your results (for example, by cross-validation)? And how will you determine which features are the most important contributors of the prediction?
Pick a Platform
Selecting the methodology of executing your approach can be quite personal. Hundreds of blog posts, forum responses, and infographics outline on the merits of each.
The factors to consider include comfort level (obviously!), the approach, and the nature of the result. Generally, you will want to have a way to visualize data, a way to analyze data, and a way to carry out the more “serious” data operations. Here is my attempt to categorize various commercial and open-source solutions:
Visualization tools
These are tools like Tableau, Periscope Data, or Microsoft Power BI, capable of powerful analytics with simple data import mechanism but are primarily designed as visualization tools. The user interface is graphical, and the analytics are largely pick-and-choose. These tools allow you to think about data from a very high level, and they are great for exploration.
General Programming Language
These are programming languages that are capable of doing many things in software engineering but also happen to be capable of analyzing data.
 Python and Scala (a Java-derived language with functional capabilities) are major players in this category. R is generally considered a statistical programming language, but its very large user base has made significant contributions to allow R to be used for other purposes such as creating a web app.

If you find your informatics requiring many different commercial tools at each step, it may be because you have not considered using one of these general
programming languages. Although the learning curve can be steep, these are incredibly powerful tools that can unlock many possibilities for a data-driven radiology practice.
Personally, this is the platform I favor the most. I use the free Anaconda by Continuum distribution, and RStudio is a good choice for R users.
Statistical software packages
SPSS, SAS, and Stata fall into this category. These tend to be proprietary software packages which provide a somewhat intuitive approach to data analysis (albeit still with a learning curve). If you are already familiar with one or more of these tools, they are excellent choices. All three suites are programmable and offer some level of GUI-based analytic support. They sit somewhere between Microsoft Excel and a general programming language. Furthermore, the biggest draw for learning these tools is the practice legacy – if your practice already implements many scripts written for SAS, then it can be cumbersome to switch to a different solution.
Big Data Tools
Big data is a vague term. In this section, I primarily use it to describe very large datasets or very fast streaming data (scale of terabytes per hour).
Solutions such as Apache Hadoop-based Hortonworks, Cloudera, and MapR are designed to tackle these challenges. Generating insights using datasets that can’t fit on a single computer is incredibly challenging even with one of these platforms (and near-impossible without some form of big-data solution). Other than raw scanner data, most radiology use cases do not get to true “big data” scale.
Other Specialized Platforms
This category serves as a catch-all for all solutions that are designed to fulfill a specific purpose not covered by the other categories. For instance, Montage is a Nuance-owned analytic tool for diagnostic reports.
SWI-Prolog is a free implementation of Prolog for logical computing, useful for artificial intelligence research. GNU Octave and Matlab are a matrix-based programming platforms which are useful for imaging analysis. Although logical and matrix-based computing languages are also general-purpose programming languages, I include them in this category because they have a specialized role in data analysis. (For example, few people would opt for creating a web app using Prolog outside of a hackathon project).
To be Continued…