Tag Archives: Data science

Your Origin Story for Data Science

There’s an origin story for every superhero; even those without superpowers (like Batman – that’s right) got started somewhere. What we sometimes forget is that there is also an origin story for every regular person, every profession, every hobby.

Source: Wikimedia Commons


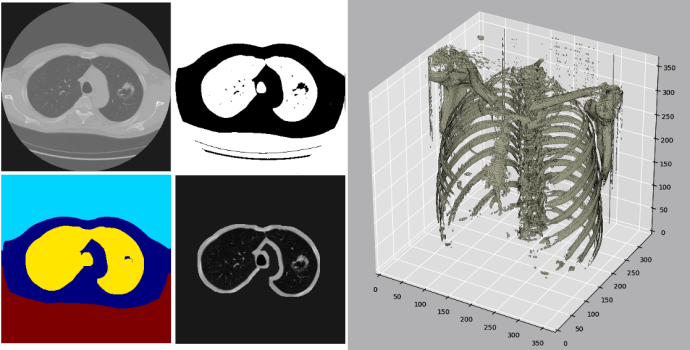
If you’re a radiologist looking to learn a few things in radiology data science, a simple web search will reveal a seemingly overwhelming amount of material you might have to know.

Fortunately, only a very small subset is necessary to start being productive.  Here are a few resources I used to get started.

Continue reading

DICOM Processing and Segmentation in Python – Radiology Data Quest

There is something strangely satisfying about being able to take things apart and putting it back together.  Inspired by the popularity of Lego sets in our childhoods, Minecraft brought this sense of wonder to video games.

For those of us who are life-long tinkerers who happen to be radiologists, I published in Radiology Data Quest a DIY on how one take DICOM apart and manipulate it.  All in Python, no less.


DICOM is a pain in the neck.  It also happens to be very helpful.  As clinical radiologists, we expect post-processing, even taking them for granted. However, the magic that occurs behind the scene…

Source: DICOM Processing and Segmentation in Python – Radiology Data Quest

When Gut Instinct and Logic Work Together

After the recent presidential election, you are probably either particularly alarmed or especially excited about the outcome.  Regardless of your particular political predilection, it is fair to say that this election puts data science on its head when so many got so wrong.

On an earlier issue of Harvard Business Review, the venerable magazine shared a piece of research from the University of Southern California on forecasting. When forecasting sales, the best estimators use a combination of intuition and logic – with both the logic-heavy and intuition-heavy forecasters performing less accurately.

In the age of artificial intelligence and big data, it can be sobering to realize that despite the staggering volume of data we are now collecting, ignoring your gut instincts can take a heavy toll on your decision-making abilities.


Source: “What type of forecaster are you?” Harvard Business Review (March): 26.


6 Elements of a Data-Driven Informatics Solution (2/3)

The first part of this discussed the heterogeneity of data projects and how a uniform approach can help hone in the solution. The first post also discussed the first two elements: Refine the question, and identifying the right data.  Here we tackle the next two elements.

img_57f1c4091698c

Plan Your Approach

At this step, we begin to go into the technicalities of data science. This post is not designed to go into the detail of each approach, but it will attempt to ask the relevant questions.

How will you process the data that you now possess? In almost all cases, this step will involve data wrangling (also known as data munging or data cleaning). To determine how the “clean” form your data must take for proper analysis, it is important to determine the transformations and algorithms necessary for your question. Continue reading

6 Elements of a Data-Driven Informatics Solution (1/3)

Big Data has become a radiology buzzword  (the others: machine learning, AI, and disruptive innovation are also up there).

However, there is a real problem with using the term Big Data – it isn’t just one set of data problems.  Big Data is a conglomerate of different data challenges: volume of data, heterogeneity of data, or the velocity of data are all important dimensions.  Machine learning and internet of things are others layers superimposed on the big data problem.

Sometimes it is helpful to step back and approach data problems with a common framework, a way to think about how and which facets of data science fit in a real-life workflow in the face of an actual problem.

Below is a 6-element framework that helps me think about data-driven informatics problems. They are generally in chronological order, but they are not “steps” because you frequently will find yourself going back and redefining many things.  However, the framework helps you maintain a big-picture outlook.  The reason any sufficiently complex data problem requires a team approach. Continue reading

Inpatient Radiology Ordering Patterns from Scratch

index

If you have taken overnight call, you quickly develop a sense for the emergency department and the inpatient floors. In my institution, radiologists develop hypotheses on how inpatient orders are placed.

For instance, sometimes it might seem as if inpatient radiology exams follow some sort of circadian rhythm.  The data look to confirm it: we see the infamous “x-ray bump” in the early morning, with the increase in CT start more gradually but last later into the day.

Also, are weekdays and weekends any different?  If so, how?

Going on a Quest

With a little coding in Python or R, one can gain a lot of insight into how our referring providers’ lives intertwine with our own. Read the full story in my new post on Radiology Data Quest.

Geeking out with CMS Outpatient Imaging Data (Lumbar MRI and Mammo)


From the Open Data Network I stumbled upon the CMS outpatient imaging data organized by state and decided to peek into the dataset and stick the data onto a US map for fun. Geek out with Joe and me in this new blog Radiology Data Quest.

Biomedical Data Science Initiative at Stanford

They are taking medical data science rather seriously. The folks at Stanford Medicine are onto something.


Source: Biomedical Data Science Initiative @ Stanford Medicine

Do’s and Don’ts of Data Science

Don’t Start with the Data
Do Start with a Good Question

Don’t think one person can do it all
Do build a well-rounded team

Don’t only use one tool
Do use the best tool for the job

Don’t brag about the size of your data
Do collect relevant data

Continue reading

Data is data

Data is the results section of a scientific paper.
Data is a graph on the dashboard.
Data is a powerful motivator when it puts what we already know about ourselves in numbers.
Data is necessarily biased because it cannot exist in a vacuum.
Data is rarely perfect or complete.
Data is the Wizard of Oz in whom we only see that which we desire to see.
Data is not meaning.
Data is not opinion.
Data is not a mirror mirror on the wall to reveal the hidden truth in it all.

At the end of the day, data is data. It’s people who write the Discussion sections.
People draw conclusions from analytics.
It’s people who create meanings.  People who form opinions.

Don’t confuse the two.