Inpatient Radiology Ordering Patterns from Scratch

index

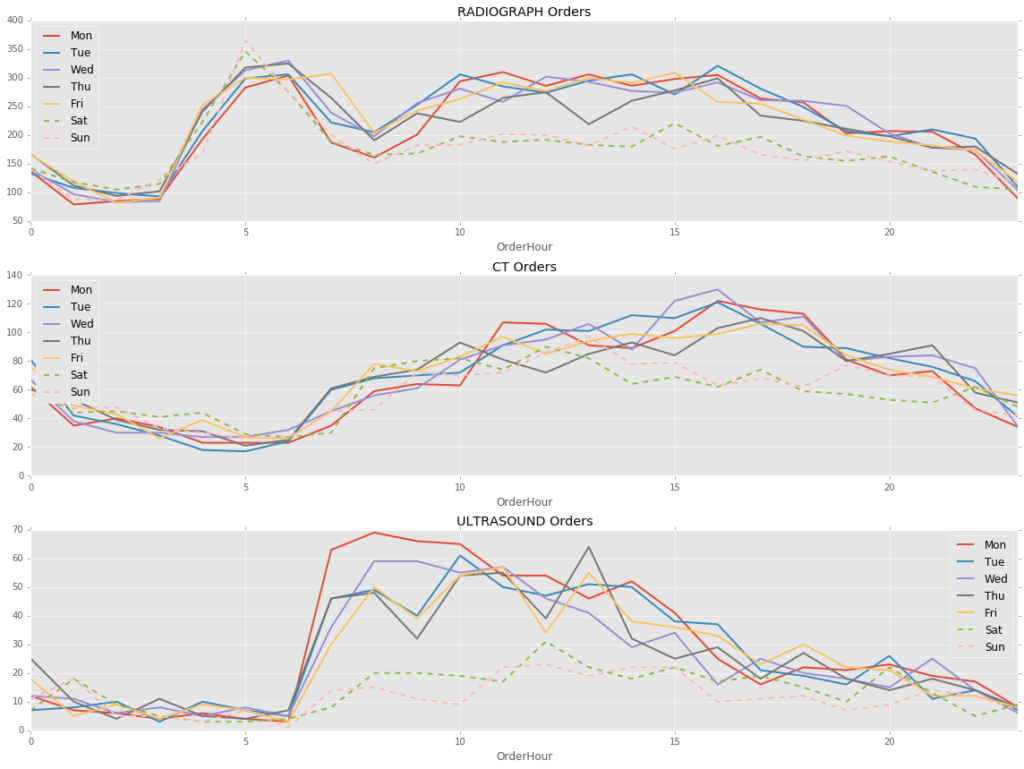
If you have taken overnight call, you quickly develop a sense for the emergency department and the inpatient floors. In my institution, radiologists develop hypotheses on how inpatient orders are placed.

For instance, sometimes it might seem as if inpatient radiology exams follow some sort of circadian rhythm.  The data look to confirm it: we see the infamous “x-ray bump” in the early morning, with the increase in CT start more gradually but last later into the day.

Also, are weekdays and weekends any different?  If so, how?

Going on a Quest

With a little coding in Python or R, one can gain a lot of insight into how our referring providers’ lives intertwine with our own. Read the full story in my new post on Radiology Data Quest.

Geeking out with CMS Outpatient Imaging Data (Lumbar MRI and Mammo)


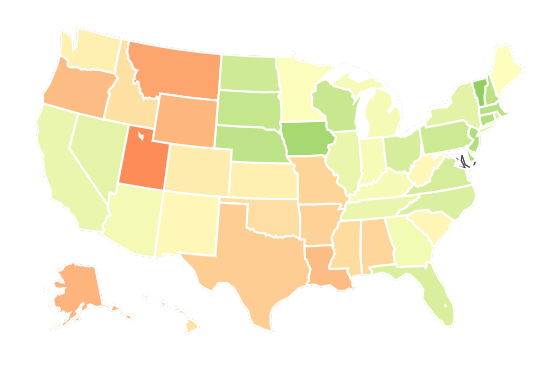
From the Open Data Network I stumbled upon the CMS outpatient imaging data organized by state and decided to peek into the dataset and stick the data onto a US map for fun. Geek out with Joe and me in this new blog Radiology Data Quest.

Biomedical Data Science Initiative at Stanford

They are taking medical data science rather seriously. The folks at Stanford Medicine are onto something.


Source: Biomedical Data Science Initiative @ Stanford Medicine

Do’s and Don’ts of Data Science

Don’t Start with the Data
Do Start with a Good Question

Don’t think one person can do it all
Do build a well-rounded team

Don’t only use one tool
Do use the best tool for the job

Don’t brag about the size of your data
Do collect relevant data

Continue reading

Bundled vs Capitated and What They Mean for Radiology (1 of 2)

img_57b4fc843c948

Did you have a chance to read the July 2016 issue of Harvard Business Review (HBR)?

Why would anyone care to subscribe to HBR, you ask?  Well, fine, you can read these for free on their website.

July’s HBR has a healthcare focus.  First is Michael Porter and Robert Kaplan’s How to Pay for Health Care, followed by Brent James and Greg Poulson’s The Case for Capitation.

Still no?  Here’s the quick run down for the closet MBA in you. Continue reading

The Radiologist’s Real Job Description

We often think of innovation as creating new technology, but innovation also comes in the form of new business models, new regulations, and new ways to perform a craft.  Radiologists are in crossroads among a myriad of such “news,” the more comprehensively discussed among which are the reimbursement changes and regulation changes which have been discussed ad infinitum (e.g. here, herehere, and more).

Rather than discussing the impact of the new healthcare regulations on radiology and the emerging high-tech, social-media-connecting, cloud-based, deep learning, big-data-supporting, iPad-friendly, segmentation-compatible solutions , maybe it is worthwhile to take a few minute to think about innovating at a much lower level.  On the level of our job description.

Photo Credit: debspoons; freedigitalphotos.net

Continue reading

The [machine learning] race is on – Don Dennison

Continue reading

Machine learning, real opportunites: Dr. Keith Dreyer’s keynote sets tone for ISC 2016

Dr. Keith Dreyer opens with a keynote during the Intersociety Summer Conference (ISC) with description of data science and overview of how machine learning have evolved over time.

He describes that machines and humans inherently see things differently. Humans are excellent at object classification, recognition of faces, understanding language, driving, and imaging diagnostics. Continue reading

Five way to keep up coding skills when you are a full time radiologist

Radiologists have a day job (or a night job, depending on your precise definition of “radiologist.”) Many people want to learn the syntax of a computer language, while some want to keep up on existing skills.

If your goals are similar to mine, these might help.  Now these are not ways to learn to write code (I’ll write about that later), but ways to brush up on existing skills.

Here are five things to help keeping up your coding skills:

Work on a Project

Most radiology practices can be improved by better use of technology  Continue reading

Two Questions for Four Data Visualization Types, and Why It Matters

QuoteNot long ago, the ability to create smart data visualizations, or dataviz, was a nice-to-have skill. For the most part, it benefited design- and data-minded managers who made a deliberate decision to invest in acquiring it. That’s changed. Now visual communication is a must-have skill for all managers, because more and more often, it’s the only way to make sense of the work they do.

A June 2016 Harvard Business Review article by Scott Berinato discusses the four types of data visualization, in their traditional “boil complex stuff down to a 2×2 matrix” method no less.  In short, what works depends on the level of details necessary to convey the purpose.

Two axes of data visualization – what works best depends on the purpose

The overall concepts are reminiscent of concepts by Edward Tufte and his many, excellent, books on visualization.

The HBR article is worth a read for anyone interested in business intelligence, data analytics, or data visualization (which, as Berinato says, is probably a misnomer – it’s not the visualization that matters, but the question it seeks to answer).