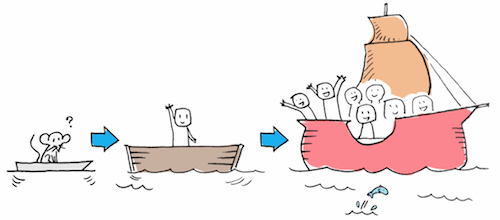
In an MVP-based approach, flagship design begins with a paper boat. And a mouse.
The concept of MVP applies to research, quality improvement, or innovation projects. In this case, MVP is not “most valuable player” (although it could make you one) but “minimum viable product.” In a nutshell, rather than the traditional approach of building only after deliberate planning and careful design, the MVP concept focuses on a just-enough set of features. At first glance, it may seem counter-intuitive: shouldn’t the greatest success come after long-term project planning and thorough discussion of all possible outcomes?
Initially, MVP was developed for anemic startup companies to get a quick infusion of revenue before developing their flagship offering. It was soon realized that this process of small-target rapid iteration yields not just faster but also better results. Gantt charts, project timelines, and table-pounding meetings are still important, but real-life experimentation is a higher priority.
When Innovation and Improvement Collide
MVP is an extension of Plan-Do-Study-Act (PDSA). It makes one assumption: “all assumptions are more likely wrong than right.” In designing a medical research proposal, you have implicitly made assumptions about some aspect of a disease’s biology. In creating a product, you inevitably face the need to make assumptions about customer needs. In starting a business, you have determined that about research outcome, or even the fundamental design.
If these assumptions are more likely wrong than right, then the best next step must be to make as few as possible before having the opportunity to test them. The MVP approach asks innovators to encapsulate as few concepts as possible into a deliverable and then bring that product to a test market to verify those assumptions. Since outcome metrics can be very difficult or expensive to obtain – just ask people who run Phase III trials or market research – limiting variables allows you to be sure that acquired data only have a small number of possible interpretations.
Two Ways of Learning from an MVP
Some approaches to software design approaches embrace the MVP concept, one of the better known being Scrum. Another product-oriented approach is called pretotyping (not to be confused with prototyping) – “faking” as much as possible with the goal of acquiring data before the making heavy financial investments.
The venerable Harvard Business Review has more – there are two types of MVPs. Your MVP can be validating – by trying an inferior product to prove a concept. It can also be invalidating, where the MVP is actually a better project than the one you plan to create.
If your MVP is a worse product than your imagined final version, success validates your idea; failure, on the other hand, doesn’t necessarily invalidate it. If your MVP offers a better experience, then failure invalidates your business model; success doesn’t necessarily validate it.
Hypothetically, if your radiology department is contemplating an investment of $3 million over 5 years on a “virtual radiology consultation” technology to improve communication, the rationale for purchase may be that busy radiologists cannot satisfy the high clinician demand for collegial discussions, and live digital discussions would solve that problem.
To test this assumption, you could deploy an invalidating MVP. For instance, this may take the form of a one-week real radiology consultation for all questions.
This solution is obviously a huge waste of valuable radiology resource and unsustainable over time. But failure invalidates one key assumption for the intended purchase. Even if successful, it may raise important points to resolve: is subspecialist availability necessary? Does the consultation need to be 24/7 or only during key hours? The virtual solution might still work, but it would work for reasons other than but you know at least one of the underlying assumptions might need reassessment.
Because of its unique combination of data, science, and machines and the interactions with patients’ lives, innovation in the industry requires much more than cool new gadgets or one-off apps that don’t get to the heart of challenges around cost, quality, and access.”


